
Page 56 - Retail Pharmacy November/Decemeber 2020
P. 56
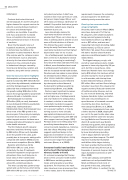
ANNUAL REPORT 55 Dispensed medicines (volume of dispensed units) have recovered from a peak-then-trough event earlier in the year. 41 39 37 35 33 29 27 25 Figure 1. Dispensed units of prescription medicine 2018-2020 2020 peak and trough driven by panic buying 2020 31 2019 2018 Prescription growth was driven by biologicals, while declines were driven by hep C treatments and acute treatments associated with communicable diseases (lower community incidence thanks to Covid-related behavioural change) Musculo-skeletal system $50.09 Genito-urinary system and sex hormones ($33.55) Respiratory system $85.59 Previous 12 months Last 12 months Systemic anti-infectives Blood and blood forming organs $66.42 Sensory organs $35.31 Cardiovascular system ($172.23) $65.29 $77.29 Alimentary tract and metabolism Nervous system Antineoplastic and immunomodulating Figure 2. Top 10 prescription categories $0 $1,000 Total Value (PBS + Patient Co-pay) (Millions) $101.81 $173.76 $3,000 $2,000 Hand sanitiser unit sales are declining to normal levels - time to reduce stock levels! 1,000 900 800 700 600 500 400 300 200 100 0 2020 sales have exceeded all previous records, but are now trending down 2020 2019 2018 Figure 3. Reducing stock levels of hand sanitiser may be prudent, given the strong downward trend in demand RETAIL PHARMACY • NOV/DEC 2020 January February March April May June July August September October November December January February March April May June July August September October November December Unit Sales - Thousands Dispensed units (millions)
